Application Case 2.4
Predicting NCAA Bowl Game Outcomes
Predicting the outcome of a college football game (or any sports game, for that matter) is an interesting and challenging problem. Therefore, challengeseeking researchers from both academics and industry have spent a great deal of effort on forecasting the outcome of sporting events. Large quantities of historic data exist in different media outlets (often publicly available) regarding the structure and outcomes of sporting events in the form of a variety of numerically or symbolically represented factors that are assumed to contribute to those outcomes.
The end-of-season bowl games are very important to colleges both financially (bringing in millions of dollars of additional revenue) as well as reputational—for recruiting quality students and highly regarded high school athletes for their athletic programs (Freeman & Brewer, 2016). Teams that are selected to compete in a given bowl game split a purse, the size of which depends on the specific bowl (some bowls are more prestigious and have higher payouts for the two teams), and therefore securing an invitation to a bowl game is the main goal of any division I-A college football program. The decision makers of the bowl games are given the authority to select and invite bowl-eligible (a team that has six wins against its Division I-A opponents in that season) successful teams (as per the ratings and rankings) that will play in an exciting and competitive game, attract fans of both schools, and keep the remaining fans tuned in via a variety of media outlets for advertising.
In a recent data mining study, Delen, Cogdell, and Kasap (2012) used 8 years of bowl game data along with three popular data mining techniques (decision trees, neural networks, and support vector machines) to predict both the classification-type outcome of a game (win versus loss) as well as the regression-type outcome (projected point difference between the scores of the two opponents). What follows is a shorthand description of their study.
Methodology
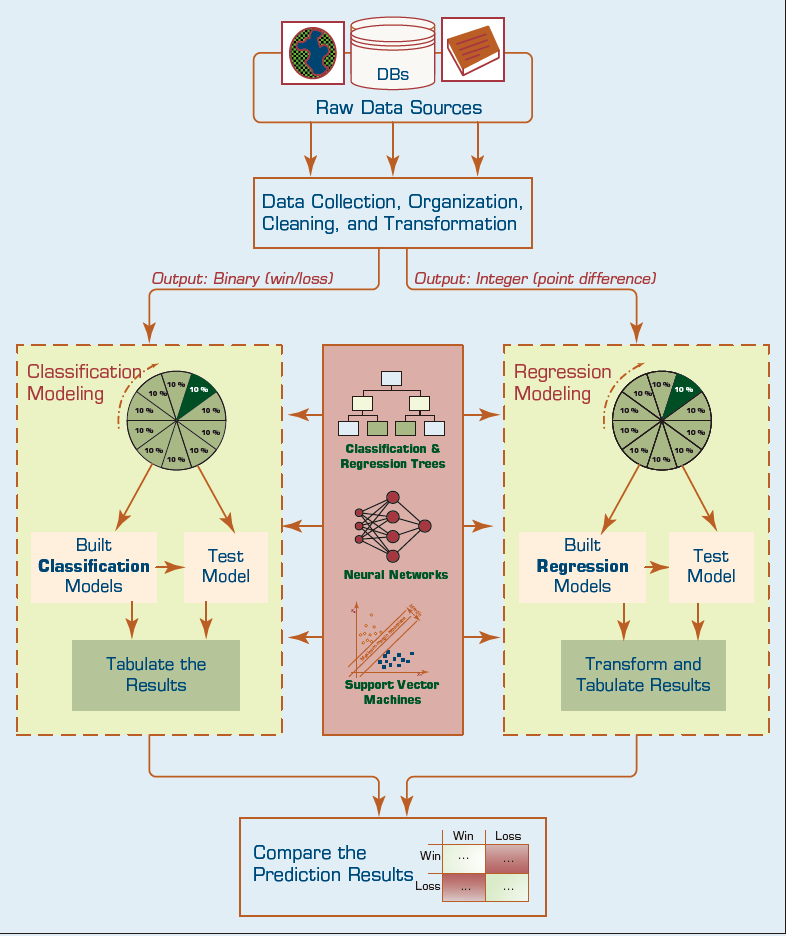
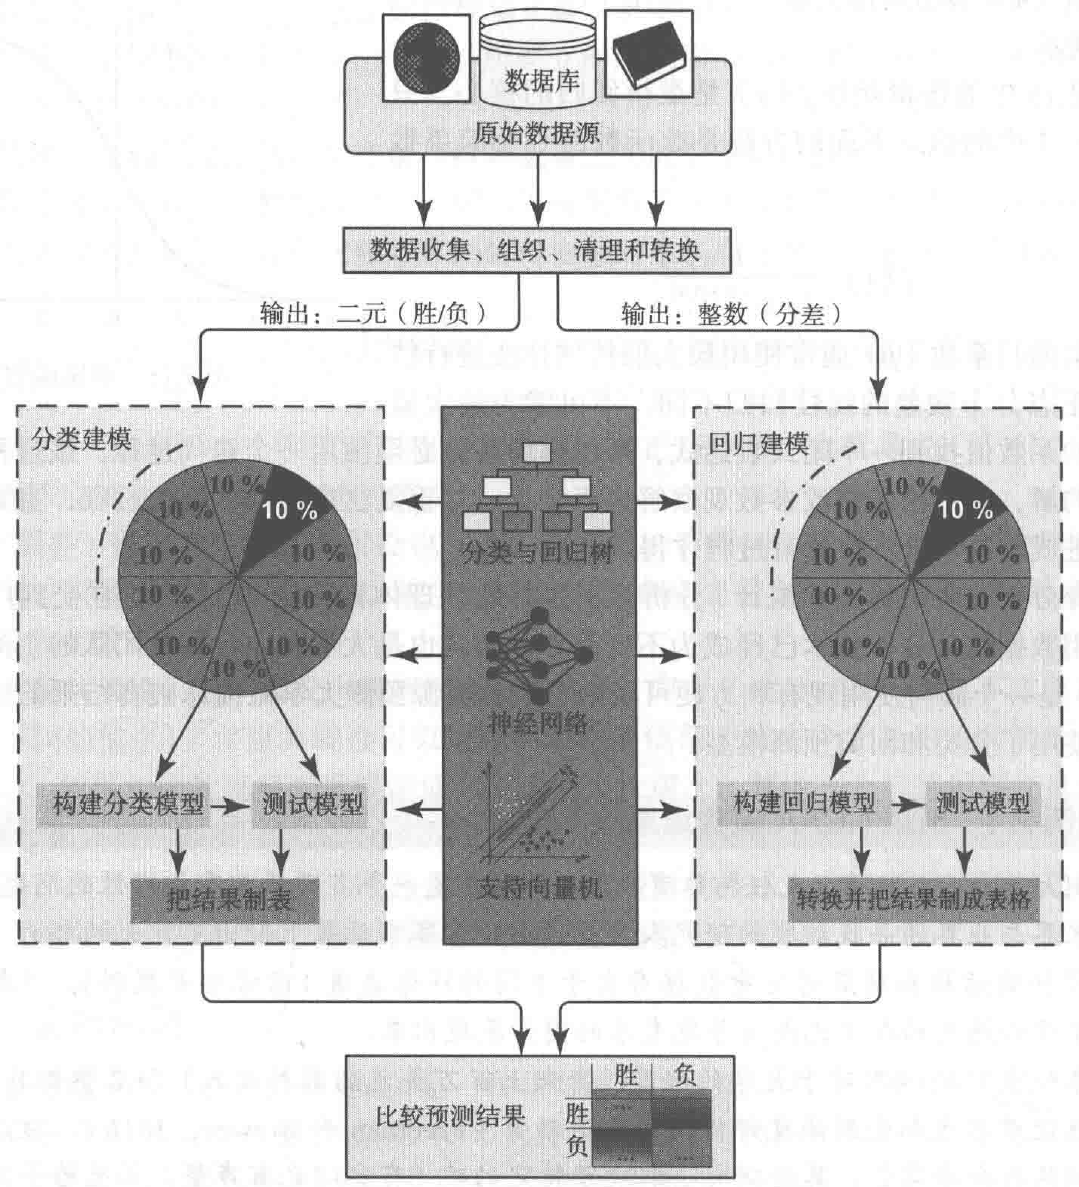
FIGURE 2.16 The Graphical Illustration of the Methodology Employed in the Study.
In this research, Delen and his colleagues followed a popular data mining methodology called CRISP-DM (Cross-Industry Standard Process for Data Mining), which is a six-step process. This popular methodology, which is covered in detail in Chapter 4, provided them with a systematic and structured way to conduct the underlying data mining study and hence improved the likelihood of obtaining accurate and reliable results. To objectively assess the prediction power of the different model types, they used a cross-validation methodology, called k-fold crossvalidation. Details on k-fold cross-validation can be found in Chapter 4. Figure 2.16 graphically illustrates the methodology employed by the researchers.
Data Acquisition and Data Preprocessing
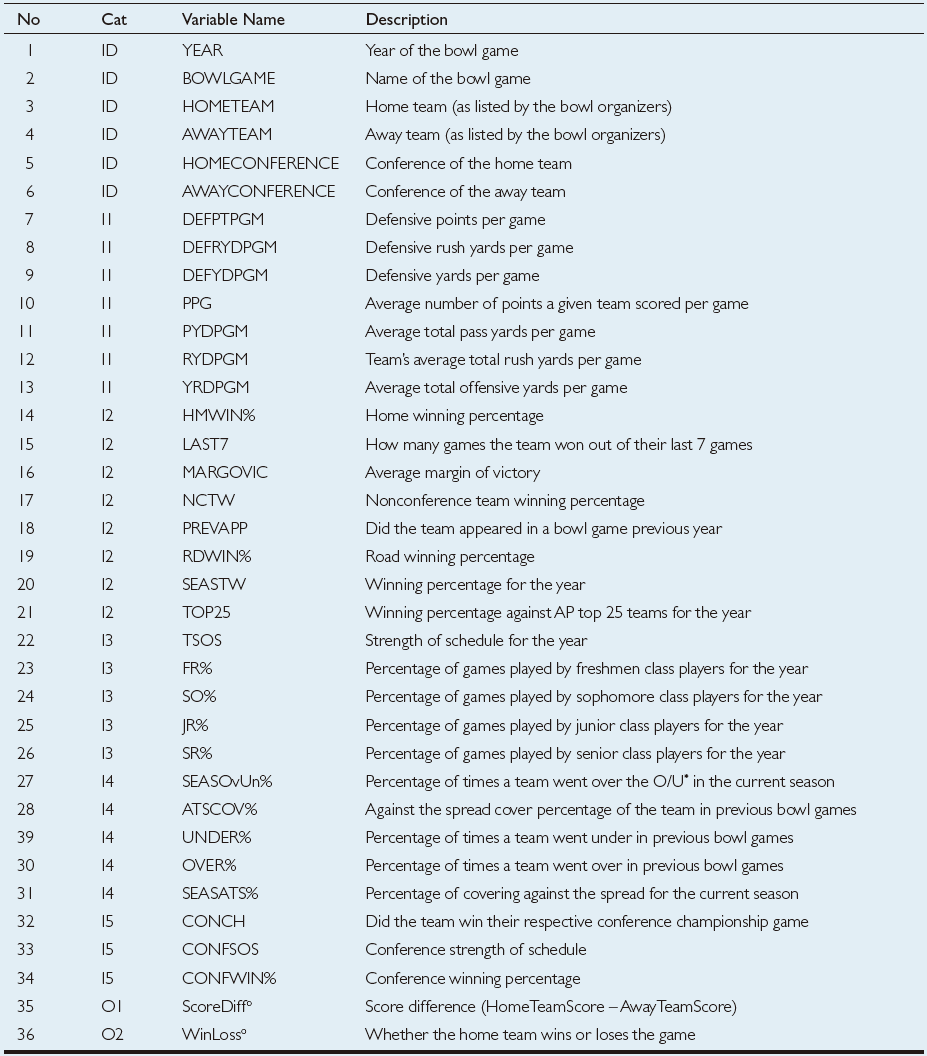
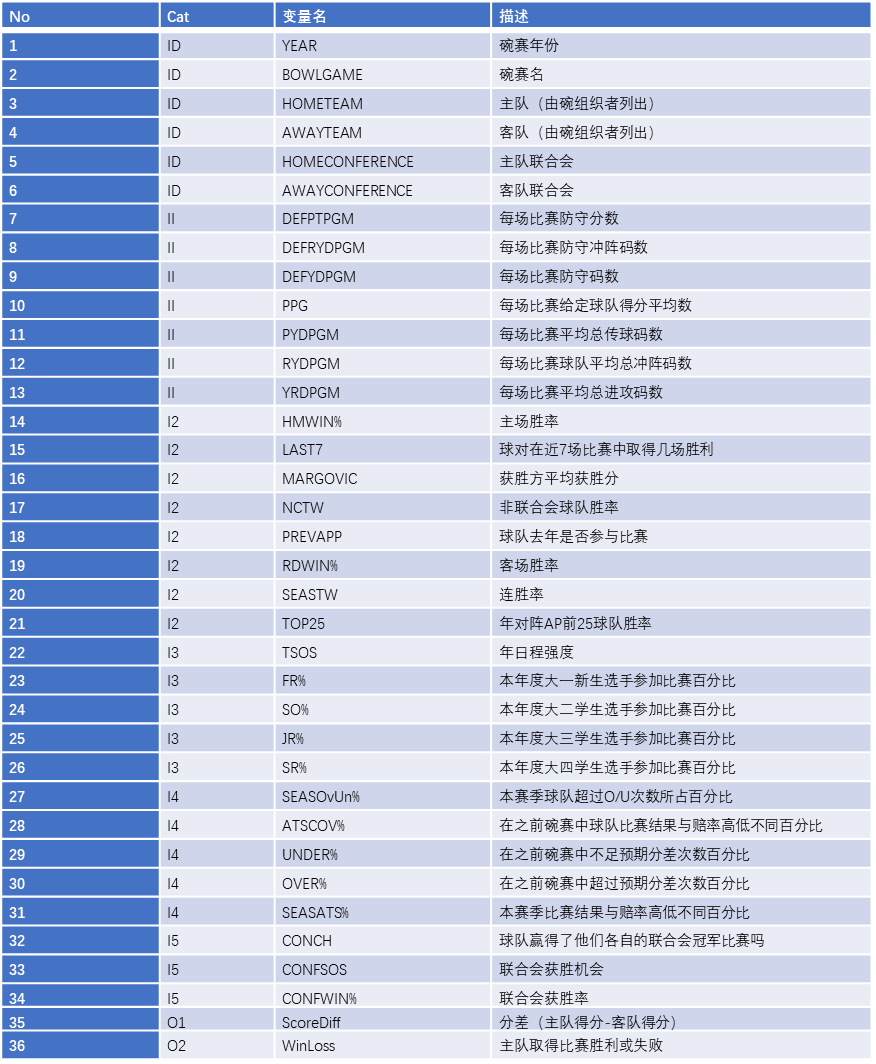
TABLE 2.5 Description of the Variables Used in the Study.
The sample data for this study is collected from a variety of sports databases available on the Web, including jhowel.net, ESPN.com, Covers.com, ncaa. org, and rauzulusstreet.com. The data set included 244 bowl games, representing a complete set of eight seasons of college football bowl games played between 2002 and 2009. We also included an outof-sample data set (2010–2011 bowl games) for additional validation purposes. Exercising one of the popular data mining rules-of-thumb, they included as much relevant information into the model as possible. Therefore, after an in-depth variable identification and collection process, they ended up with a data set that included 36 variables, of which the first 6 were the identifying variables (i.e., name and the year of the bowl game, home and away team names and their athletic conferences—see variables 1–6 in Table 2.5), followed by 28 input variables (which included variables delineating a team’s seasonal statistics on offense and defense, game outcomes, team composition characteristics, athletic conferencecharacteristics, and how they fared against the odds— see variables 7–34 in Table 2.5), and finally the last two were the output variables (i.e., ScoreDiff—the score difference between the home team and the away team represented with an integer number, and WinLoss—whether the home team won or lost the bowl game represented with a nominal label).
In the formulation of the data set, each row (a.k.a. tuple, case, sample, example, etc.) represented a bowl game, and each column stood for a variable (i.e., identifier/input or output type). To represent the game-related comparative characteristics of the two opponent teams, in the input variables, we calculated and used the differences between the measures of the home and away teams. All these variable values are calculated from the home team’s perspective. For instance, the variable PPG (average number of points a team scored per game) represents the difference between the home team’s PPG and away team’s PPG. The output variables represent whether the home team wins or loses the bowl game. That is, if the ScoreDiff variable takes a positive integer number, then the home team is expected to win the game by that margin, otherwise (if the ScoreDiff variable takes a negative integer number) then the home team is expected to lose the game by that margin. In the case of WinLoss, the value of the output variable is a binary label, “Win” or “Loss” indicating the outcome of the game for the home team.
Results and Evaluation
In this study, three popular prediction techniques are used to build models (and to compare them to each other): artificial neural networks, decision trees, and support vector machines. These prediction techniques are selected based on their capability of modeling both classification as well as regression-type prediction problems and their popularity in recently published data mining literature. More details about these popular data mining methods can be found in Chapter 4.
To compare predictive accuracy of all models to one another, the researchers used a stratified k-fold cross-validation methodology. In a stratified version of k-fold cross-validation, the folds are created in a way that they contain approximately the same proportion of predictor labels (i.e., classes) as the original data set. In this study, the value of k is set to 10 (i.e., the complete set of 244 samples are split into 10 subsets, each having about 25 samples), which is a common practice in predictive data mining applications. A graphical depiction of the 10-fold cross-validations was shown earlier in this chapter. To compare the prediction models that were developed using the aforementioned three data mining techniques, the researchers chose to use three common performance criteria: accuracy, sensitivity, and specificity. The simple formulas for these metrics were also explained earlier in this chapter.
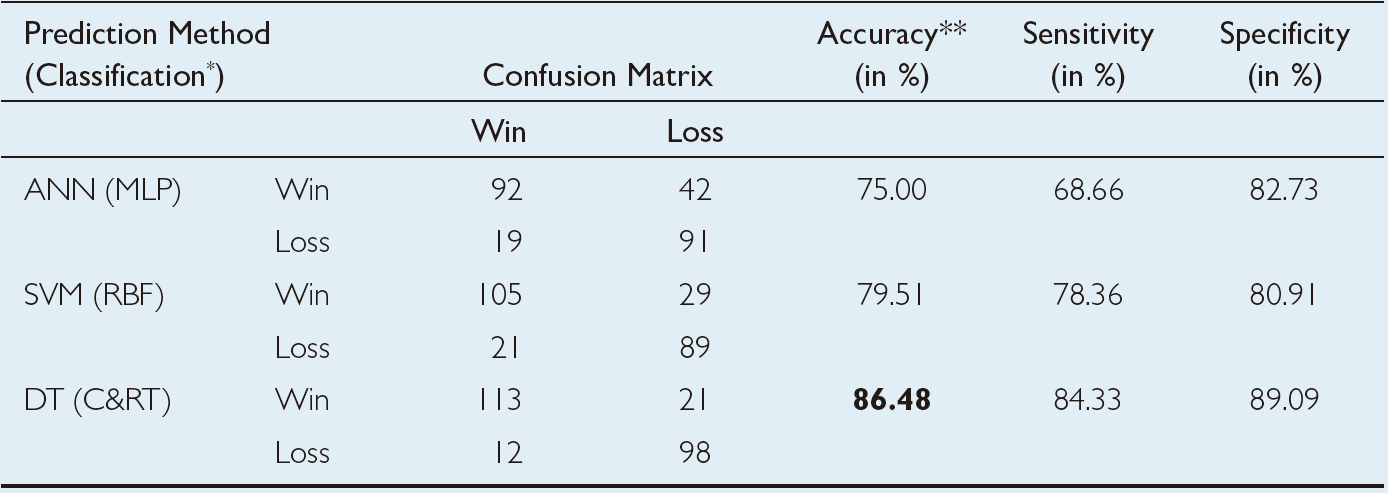
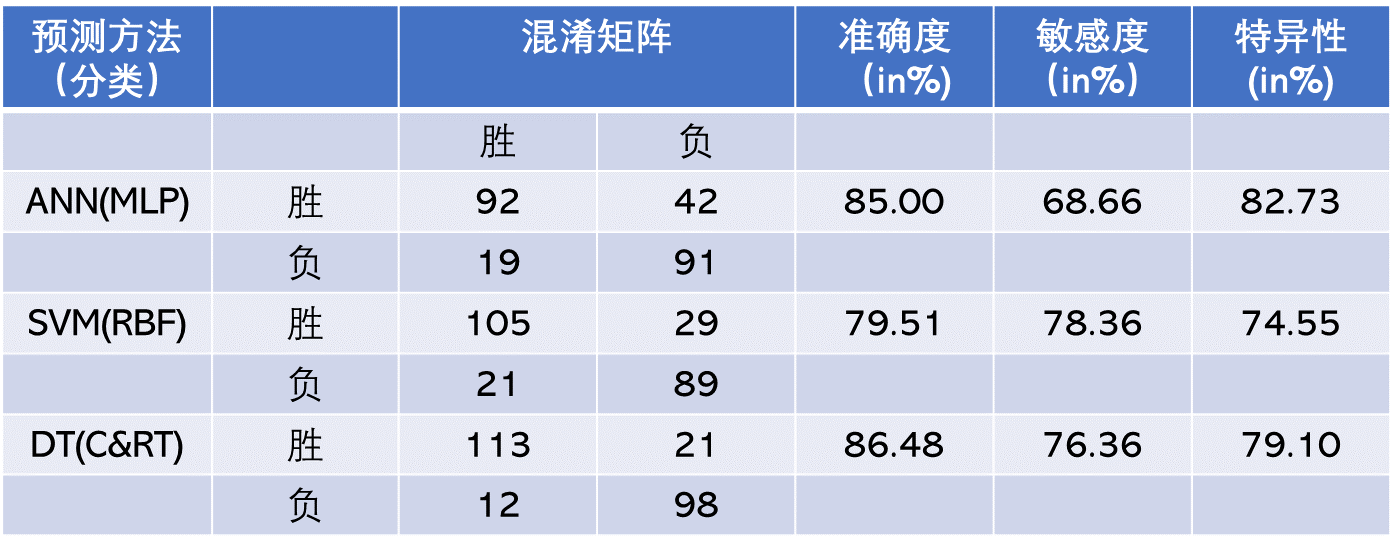
TABLE 2.6 Prediction Results for the Direct Classification Methodology.
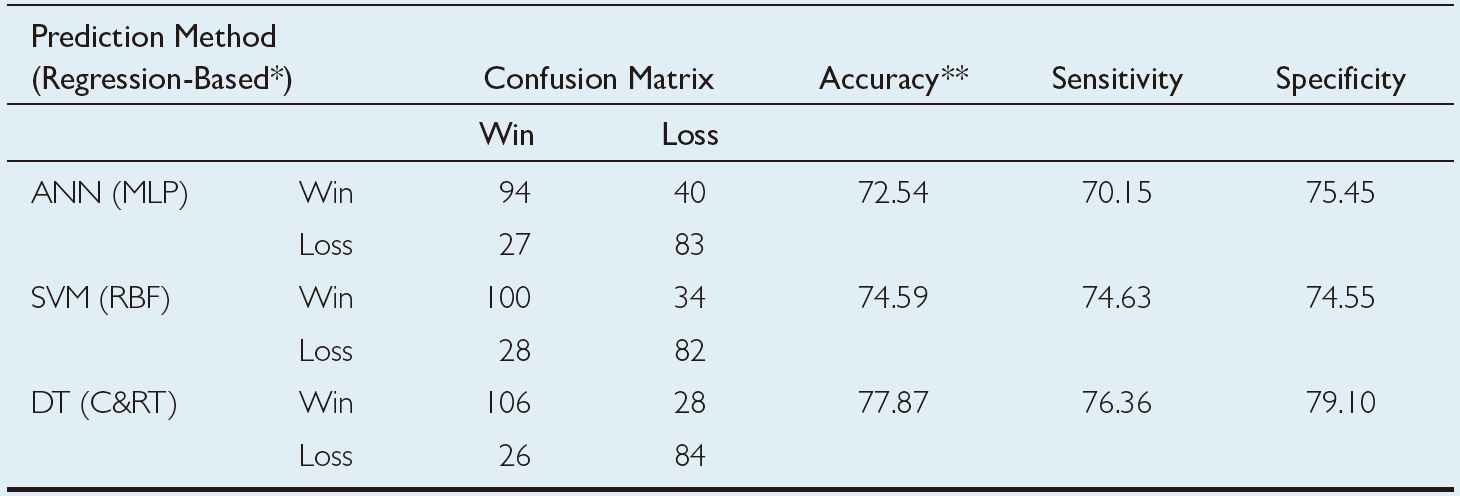
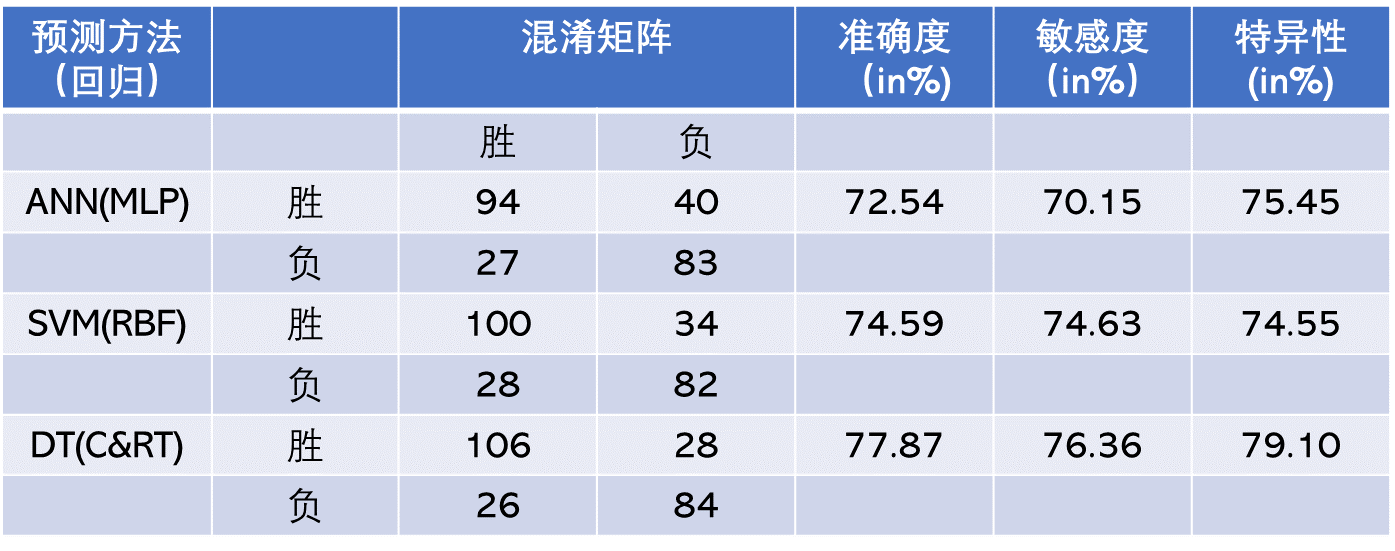
TABLE 2.7 Prediction Results for the Regression-Based Classification Methodology.
The prediction results of the three modeling techniques are presented in Table 2.6 and Table 2.7. Table 2.6 presents the 10-fold cross-validation results of the classification methodology where the three data mining techniques are formulated to have a binary-nominal output variable (i.e., WinLoss). Table 2.7 presents the 10-fold cross-validation results of the regression-based classification methodology, where the three data mining techniques are formulated to have a numerical output variable (i.e., ScoreDiff). In the regression-based classification prediction, the numerical output of the models is converted to a classification type by labeling the positive WinLoss numbers with a “Win” and negative WinLoss numbers with a “Loss,” and then tabulating them in the confusion matrixes. Using the confusion matrices, the overall prediction accuracy, sensitivity, and specificity of each model type are calculated and presented in these two tables. As the results indicate, the classification-type prediction methods performed better than regression-based classification-type prediction methodology. Among the three data mining technologies, classification and regression trees produced better prediction accuracy in both prediction methodologies. Overall, classification and regression tree classification models produced a 10-fold crossvalidation accuracy of 86.48%, followed by support vector machines (with a 10-fold cross-validation accuracy of 79.51%) and neural networks (with a 10-fold cross-validation accuracy of 75.00%). Using a t-test, researchers found that these accuracy values were significantly different at 0.05 alpha level, that is, the decision tree is a significantly better predictor of this domain than the neural network and support vector machine, and the support vector machine is a significantly better predictor than neural networks.
The results of the study showed that the classification-type models predict the game outcomes better than regression-based classification models. Even though these results are specific to the application domain and the data used in this study, and therefore should not be generalized beyond the scope of the study, they are exciting because decision trees are not only the best predictors but also the best in understanding and deployment, compared to the other two machine-learning techniques employed in this study. More details about this study can be found in Delen et al. (2012).